The Admin Portal provides access to the Dashboards where you can access usage, outcomes and CME data for your learners.
How to Use the Dashboards (Access, Filtering, Downloading, and Sharing)
🎥 Video overview of how to access and use some of the dashboard features.
There are 2 methods for accessing the dashboards: via the Group Admin Portal, or, directly using the Dashboards URL. The latter gives you access to additional features to be able to share links to filtered dashboards with your colleagues.
Access via Group Admin Portal
When to use this: easily access the dashboards in the same experience that you can access Content Assignment and Manage CME. Avoid having to navigate back and forth between different applications when looking up radiologists' data and taking action by creating assignments or downloading CME certificates.
-
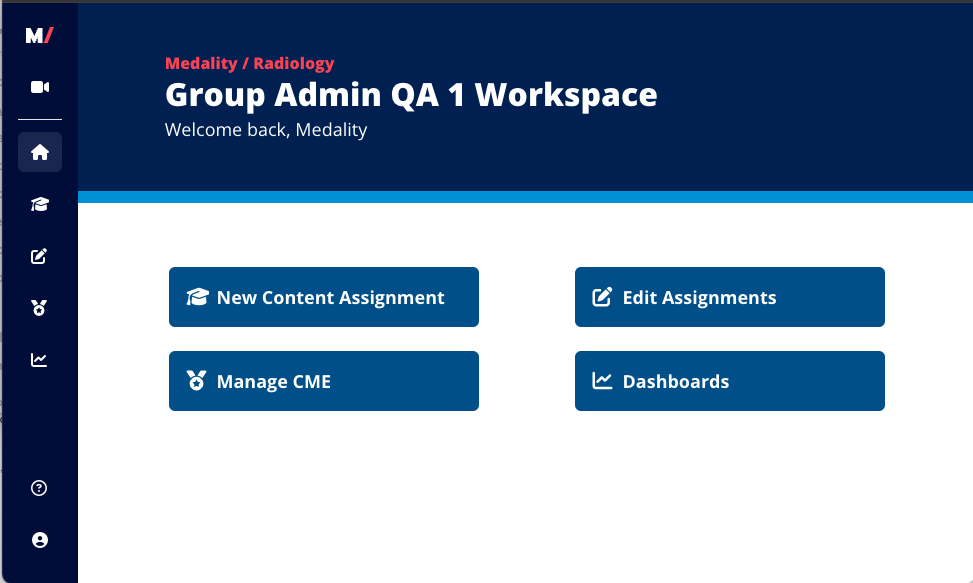
Go to https://mrionline.com/group-admin/ and login with your username and password.
-
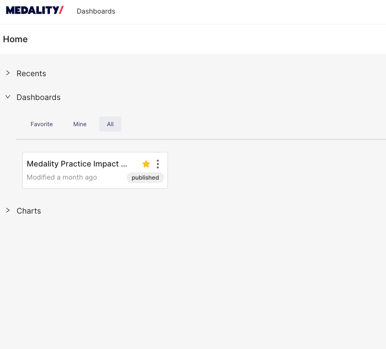
Select Dashboards and this will open your dashboards right in the Admin Portal.
How to Use Filters
-
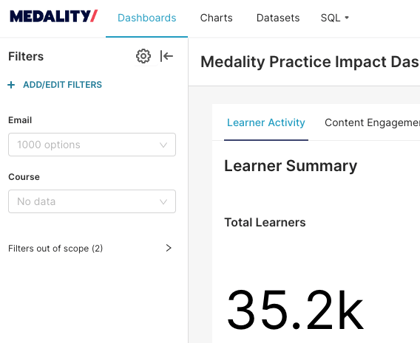
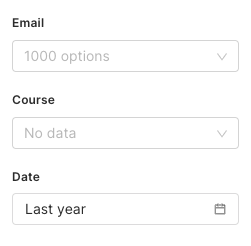
When you are using your dashboards, you select select filters in the left-side panel.
-
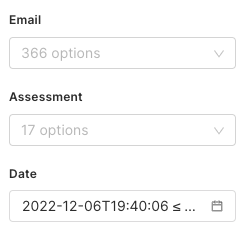
The currently available filters are:
-
Email of the learner you want to filter.
-
Course you want to filter.
-
On the Learner Outcomes tab this is called Assessment.
-
-
Date you want to filter. This is currently not available on the Learner Activity dashboard.
-
-
When you have entered your filters, select Apply Filters.
You can select Clear All to remove all your selections, or you can remove each filter select individually.
You can select the arrow if you want to hide the filter panel to increase the size of the dashboard for easier viewing.

How to Download Data
-
When you are using your dashboards, you can select the 3-Dot Menu at the top right.
⇒ Here you can select Export to PDF or Download as Image. This is useful if you want to add this dashboard to an email or a presentation.
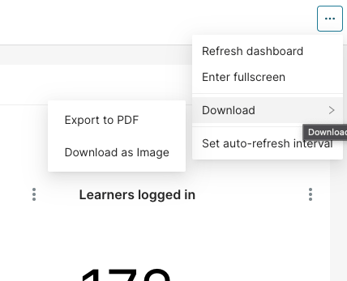
2. When you are viewing a specific chart or table, you can select the 3-Dot Menu on that chart and then select Download
⇒ You can download as .CSV or Excel, or, as an image.

Access via the Dashboards URL
When to use this: if you want access to additional dashboard-specific features such as: sharing links to specific dashboard views you have pre-filtered with your colleagues who also have dashboard access.
- Go to https://data.app.mrionline.com/. You will see a prompt to SIGN IN WITH OPENEDX. Go ahead and select this.
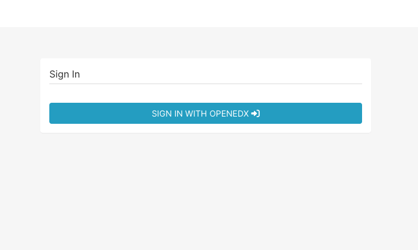
- You will see another prompt to enter your username and password, and, Sign In With Medality. Enter your Username and Password and click Sign in.

3. After logging in, then access the Dashboards by selecting Medality Practice Impact Dashboards.
4. Once you are in, you have access to the same dashboards just like you would if you logged in via the Admin Portal with mostly the same functionality.
-
- See How to Use Filters and How to Download Data above.
- Since you're logged directly into the dashboards, you can share a link to the dashboards with your colleagues if they also have access.
Note that if you are already logged into the dashboards via the admin portal and you login directly via the dashboard URL, or vice versa, you may be logged out of your other dashboard session.
How to Share Dashboards
This option is only available if you accessed the dashboards via the dashboards URL.
-
When you are using your dashboards, you can select the 3-Dot Menu at the top right.
⇒ Here you can select Share and Copy Permalink to Email.
⇒ This will copy the link to your dashboard, which includes any filter selections you’ve made, and paste into an email or document to share with your colleagues.

2. When you are viewing a specific chart or table, you can select the 3-Dot Menu on that chart and then select Share and Copy Permalink to Email.

Understanding the Data
The dashboards are currently separated into 4 sections, each focused on a different type of data.
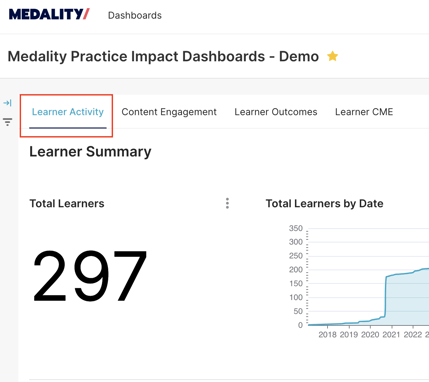
Learner Activity
Shows total number of learners and their activity on the platform.
- After you have accessed the Dashboards, make sure you have selected Learner Activity.
- This dashboard allows you to filter by the following:
-
Email of the learner you want to filter.
-
Course you want to filter.
-
This tab cannot currently be filtered by date - it will show data for all time.
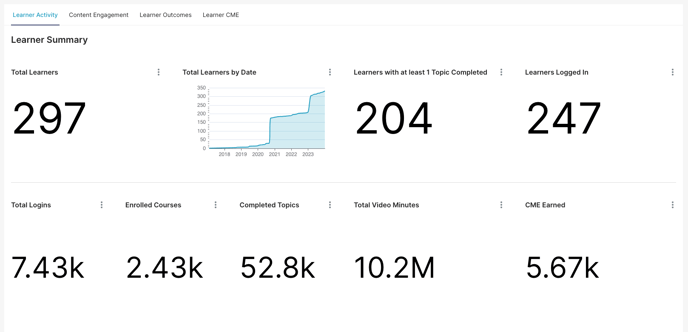
- Contained in this dashboard are the following charts and data points:
- Total Learners - the total number of learners in your group with an active membership.
- Total Learners by date - the total number of learners over time.
- Learners with at least 1 Topic Completed - the total number of your current learners who have completed at least 1 topic. We consider these learners "active."
- Learners Logged In - the total number of your learners who have logged in at least 1 time.
- Total Logins - the total number of times your learners have logged in.
- Enrolled Courses - the total number of courses that your learners and enrolled in (meaning they completed at least 1 topic).
- Completed Topics - the total number of topics that your learners have completed.
- Total Video Minutes - the total number video minutes your learners have watched.
- CME Earned - the total amount of CME your learners have earned.
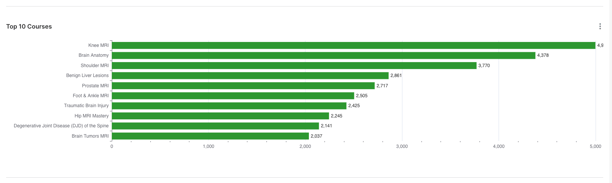
- Top 10 Courses - the top 10 most popular courses by number of learners who have enrolled.
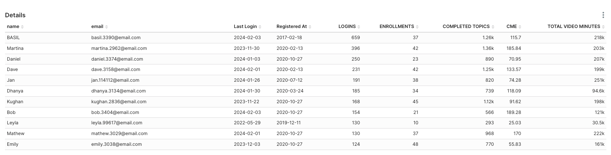
- Details - detailed information about learners in your group. Contains
name, email, date of last login, date of registration, total logins, total course enrollments, total completed topics, total CME earned and total video minutes.
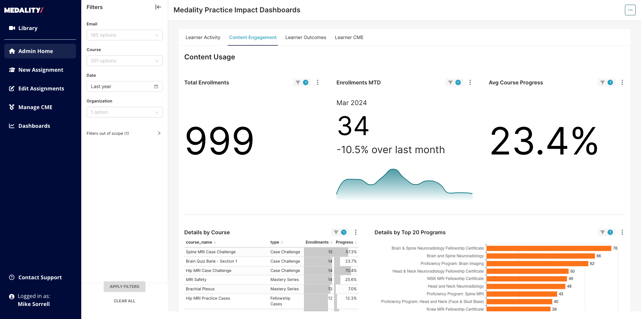
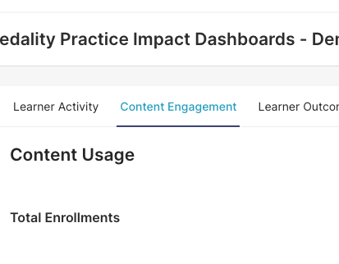
Content Engagement
Shows metrics on course usage as well as subspecialty, modality, and anatomy.
- After you have accessed the Dashboards, make sure you have selected Content Engagement.
- This dashboard allows you to filter by the following:
-
Email of the learner you want to filter.
-
Course you want to filter.
- Date you want to filter. This defaults to the prior 365 days from today.
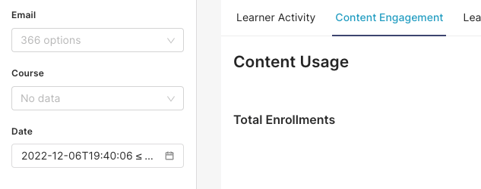
-
- Contained in this dashboard are the following charts and data points:
- Total Enrollments - Count of learner course enrollments.
- Enrollments MTD - Count of enrollments comparing to the previous period. considering - in the screenshot, it is comparing to the previous month.
- Avg Course Progress - Average progress that learners have made in their courses.
- Details by Course - Number of enrollments and average progress by course.
- Details by Program - Number of course enrollments by Program.
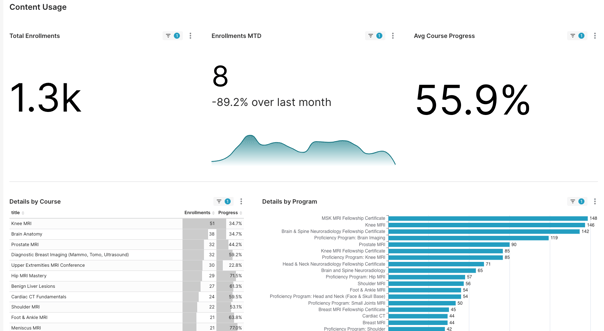
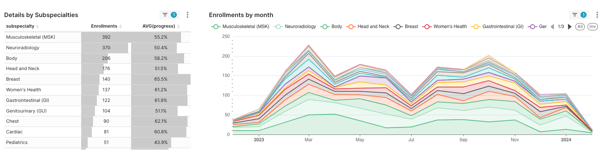
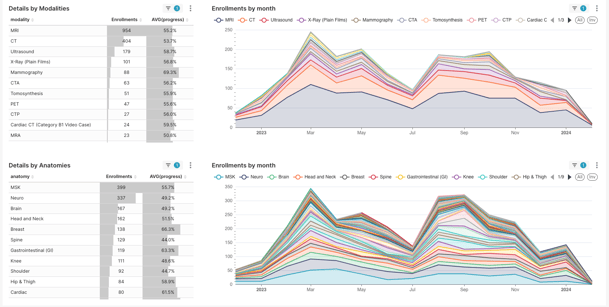
- Details by Subspecialty/Modality/Anatomy - Number of course enrollments and average progress by Subspecialty/Modality/Anatomy. This data is also presented overtime.
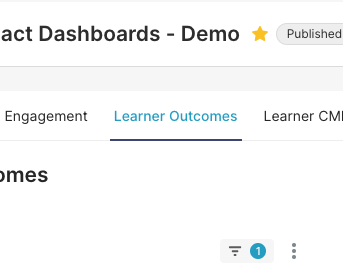
Learner Outcomes
Shows assessment outcomes based on data collected from learning completing practice cases on the platform.
- After you have accessed the Dashboards, make sure you have selected Learner Outcomes.
- This dashboard allows you to filter by the following:
-
Email of the learner you want to filter.
-
Assessment you want to filter.
- Date you want to filter. This defaults to the prior 365 days from today.
-
- Contained in this dashboard are the following charts and datapoints:
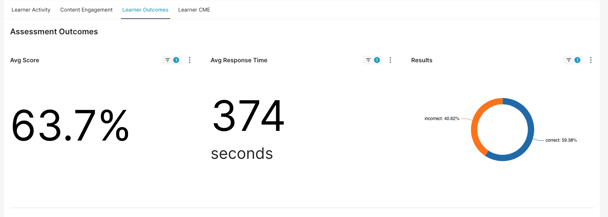
- Avg Score - average number of quiz problems that learners get correct.
- Avg Response Time - average number of seconds it takes learners to answer a quiz problem. This excludes responses that are longer than 60 minutes (3600 seconds), and quiz problems that we do not capture time for (applies to quiz problems that do not have a scrollable DICOM case).
- Results - % of correct vs incorrect out of the total responses.
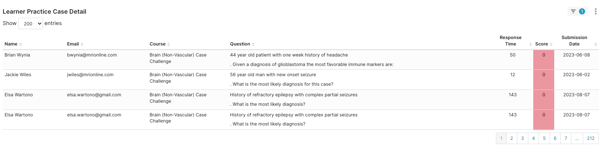
- Learner Outcomes - shows for each learner on each assessment/course their progress, their average score, and the average response time.
- Learner Practice Case Detail - shows for each learner, for each course, for each quiz question, what their response time was, if they got it correct (0 and red means incorrect, 1 and green means correct), and when it was submitted.
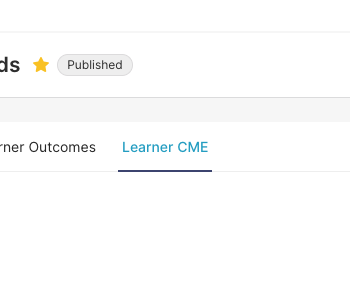
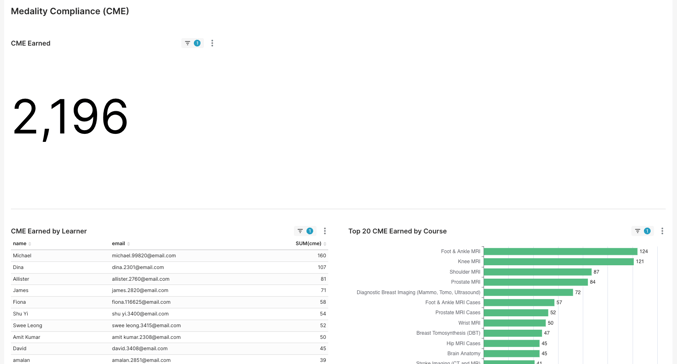
Learner CME
Shows data on CME earned by learners by parent program, course, subspecialties and modalities.
Shows metrics on course usage as well as subspecialty, modality, and anatomy.
- After you have accessed the Dashboards, make sure you have selected Learner CME.
- This dashboard allows you to filter by the following:
-
Email of the learner you want to filter.
-
Course you want to filter.
- Date you want to filter. This defaults to the prior 365 days from today.
-
- Contained in this dashboard are the following charts and datapoints:
- CME Earned - the total amount of CME earned by learners at your group.
- CME Earned by Learner - the amount of CME earned by learner.
- Top 20 CME Earned by Course - the top 20 courses by earned CME.
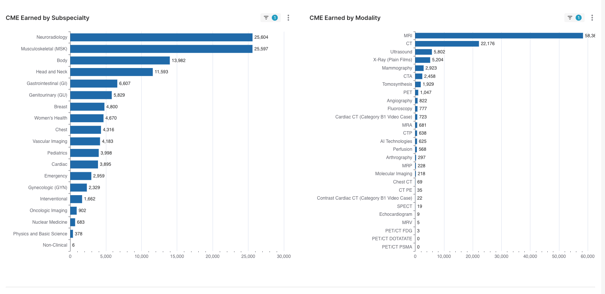
- CME Earned by Subspecialty - total CME by subspecialty.
- CME Earned by Modality - total CME by modality
- Learner Details - Topic Level - this shows CME earned for each individual topic that each learner has completed. It also includes the amount of video watch time, and the earned date. Note that CME cannot be claimed by learners for increments smaller that .25. We display smaller increments than this in the raw data here as most of our content is less than 5 minutes long.
- Learner Details - Course Level - this shows CME earned for each course that each learner has participated in. It also includes the amount of video watch time, and the last earned date. Note that CME cannot be claimed by learners for increments smaller that .25. We display smaller increments than this in the raw data here as most of our content is less than 5 minutes long.